Simple Linear Regression Wikipedia
The purpose of this exercise is not to learn about "Linear regression" but to exercise some simple awk operations on simple data sets that will be equivalent to performing of a simple linear regression calculation. You might be surprised how easy it could be done...
The file "regression.dat" contains 2 rows of numbers, for convenience named as \(x_i\) and \(y_i\), where \(i\) is the row (line) number. I will try to follow the nomenclature described on the wikipage.
Suppose there are \(n\) data points \({(x_i, y_i), i = 1, ..., n}\). The function that describes \(x\) and \(y\) is:
\(y_i = \alpha + \beta x_i + \varepsilon_i\).
The goal is to find the equation of the straight line
\(y=\alpha +\beta x\),
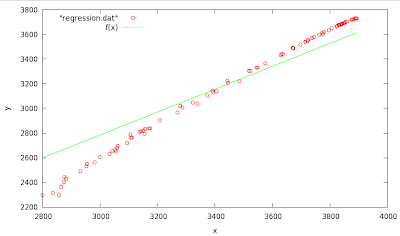
which would provide a "best" fit for the data points. Let, at the begging, assume \(\alpha=0\) which will result to a "best" fit of a straight line which passes through the origin \((0,0)\). There is a simple expression on how to obtain the \(\beta\) parameter
\({\displaystyle {\hat {\beta }}={\frac {\sum _{i=1}^{n}x_{i}y_{i}}{\sum _{i=1}^{n}x_{i}^{2}}}={\frac {\overline {xy}}{\overline {x^{2}}}}}\)
- Write an awk script (or one line) that will calculate the beta from the equation above.
You will be sutprised how easy it could be calculated...
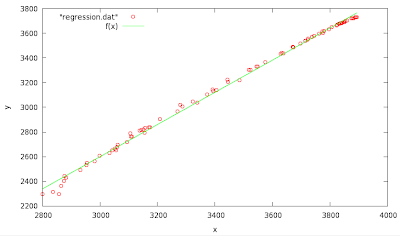
The correct answer for \(\displaystyle {\hat {\beta}}\) is 0.928142 - Write two scripts, one for the average values \(\overline {x}, \overline {y}\) and then use the numbers in the second (directly in the code), to obtain the results in the case when \(\alpha\) is not constrained to \(0\).
Answer: \(\displaystyle {\hat {\alpha}}=-1314.16; \displaystyle {\hat {\beta}}=1.30453\).
\({\displaystyle {\hat {\beta }}={\frac {\sum _{i=1}^{n}(x_{i}-\overline {x})i(y_{i}-\overline {y})}{\sum _{i=1}^{n}(x_{i}-\overline {x})^{2}}}}\)
\({\displaystyle {\hat {\alpha }}=\overline {y}-\displaystyle {\hat {\beta }}\overline {x}}\)
You can use any program you want, to compare the results for the corresponding linear fit. Here is a solution in gnuplot:
f(x)=a+b*x
a=0
fit f(x) "regression.dat" via b

Final set of parameters            Asymptotic Standard Error
=======================            ==========================
b               = 0.928142         +/- 0.004221     (0.4548%)
f(x)=a+b*x
fit f(x) "regression.dat" via a,b

Final set of parameters            Asymptotic Standard Error
=======================            ==========================
a               = -1314.16         +/- 27.58        (2.099%)
b               = 1.30453          +/- 0.00794      (0.6086%)
Possible solutions:
1)
$ awk '{up= up + $1*$2; down= down + $1*$1;} END{print up/down}' regression.dat
0.928142
2)
$ awk '{x= x + $1; y= y + $2;N=NR} END{print x/N, y/N}' regression.dat
3455.49  3193.63
$ awk '{up= up + ($1-3455.49)*($2-3193.63); down= down + ($1-3455.49)**2} END{print "b="up/down" a="3193.63-up/down*3455.49}' regression.dat
b=1.30453  a=-1314.16
Files