Gaussian smearing
Sometimes it is useful or necessary to apply Gaussian smearing on your discrete values. For example if you want to add temperature broadening on theoretically calculated spectra (from Lattice Dynamics, normal mode analysis etc.).
Here is a code that shows how it could be done in awk (illustrating the use of functions as well).
1 2 3 4 5 6 7 8 9 10 11 12 13 14 15 16 17 18 19 20 21 22 23 24 25 26 27 28 29 30 31 32 33 | |
Here are a couple of interesting (or not) points in the code.
In the #awk BEGIN section, we define default FWHM value in case none is provided on the command line. There are minimum checks that facilitate the command line input. When the script is executed, the argument values are stored in ARGV array and the number of arguments in ARGC. The zeroth element is the script's name itself. 1st will have the first parameter and so on. So, if ARGC==3 (0, 1 and 2 will count as 3) then we set the second argument as FWHM in our script and decrease the ARGC back to 2 to trick the script that we have only 2 parameters on the command line. Otherwise, awk will try to read our 3rd parameter as a regular file.
Then, for each line that is not a comment, the script reads the value in the first column and store it locally, while trying to keep track of the smallest and greatest value.
The END section, essentially runs a loop over a range slightly larger than fmax-fmin and in turns for (f=1;f<=nfreq;f++) calculates Gaussian contribution from each peak.
The last section in the script is a user defined function for the Gaussian function with small precautions to avoid errors when the numbers become unreasonably small.
To run the script:
./Gauss-smearing.awk freq.dat 10
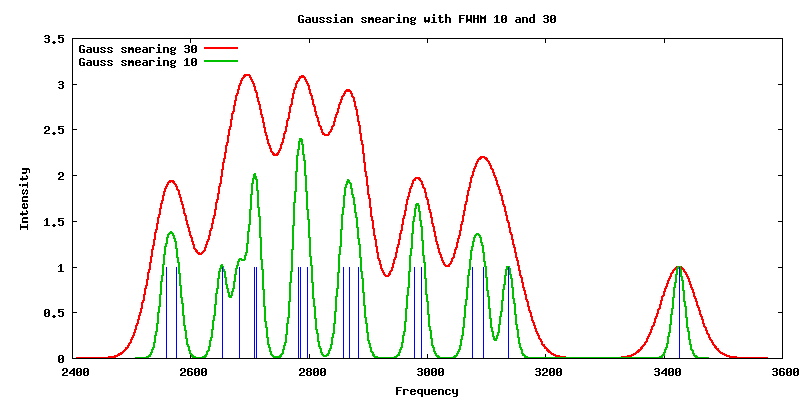
Here is the result from a Gnuplot script that calls the awk script directly, that avoids unnecessary creation of temporary files.
All scripts and data files are attached bellow.
Files
- gauss-smear-data.awk
- freq.dat
- ps-plot-v01.gnu - Gnuplot script
Comment
The script requires only small changes to handle intensities as well, can you do it yourself?